
•    Recent market commentary highlights the concentration of the rally and performance gaps between Large and Small Cap stocks, with the spread between S&P 500 and Russell 2000 returns near historic levels.

•    This discrepancy is more likely an expression of leverage rather than size.

•    Examination of leveraged companies' valuations since 2022 reveals how rising real rates have influenced the divergence between cash-rich and debt-burdened firms, a trend that may persist until real yields decrease.
Lately, there has been considerable commentary about the concentration of the current market rally and the performance discrepancy between Large and Small Cap stocks. As illustrated by the chart below, the difference in returns over the last 3 years between the S&P 500 Index and the Russell 2000 Index is near historic levels. However, we argue that this discrepancy is less about large versus small and more about rich versus poor in a rising rate environment, with Small Cap performance merely one manifestation of this dynamic.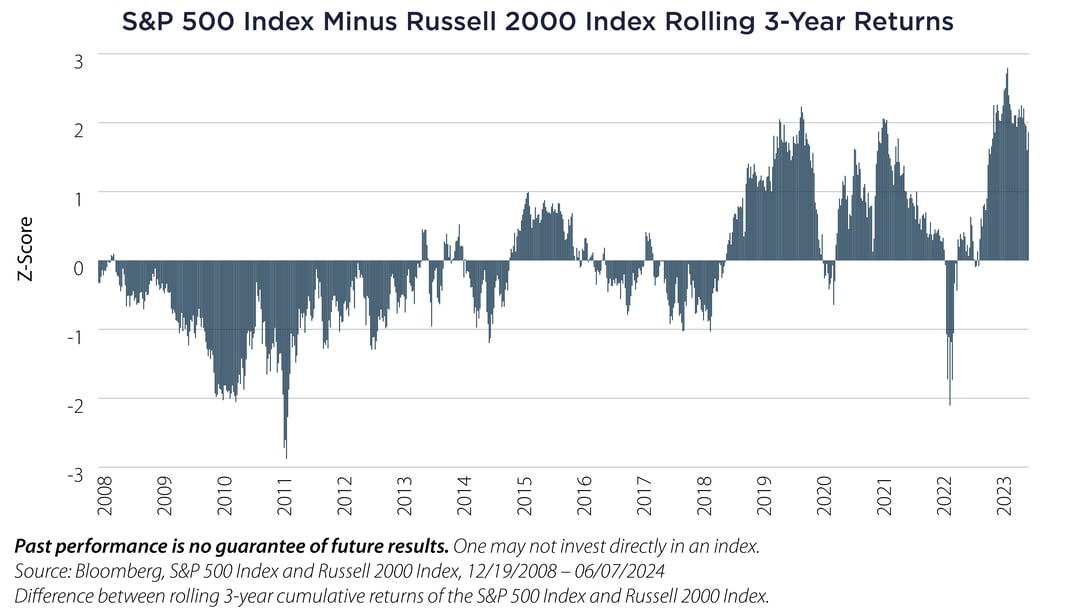
The fact that the Russell 2000 Index currently exceeds 4x Net Debt/EBITDA, characteristic of high yield issuance, suggests that Small Cap stocks generally fall within the highly leveraged category. Since the onset of rising interest rates, leverage, especially the prevalence of floating rate debt within this category, has burdened the business models of these firms. In contrast, cash-rich companies stand to benefit from higher rates, generating excess income from their balance sheets. This trend has largely influenced stock performance since the market bottom around the end of 2022. The chart below illustrates this, displaying the outperformance of a composite of low-leverage companies (Cash Rich Index) compared to high-leverage counterparts (High Leverage Index) since September 2022.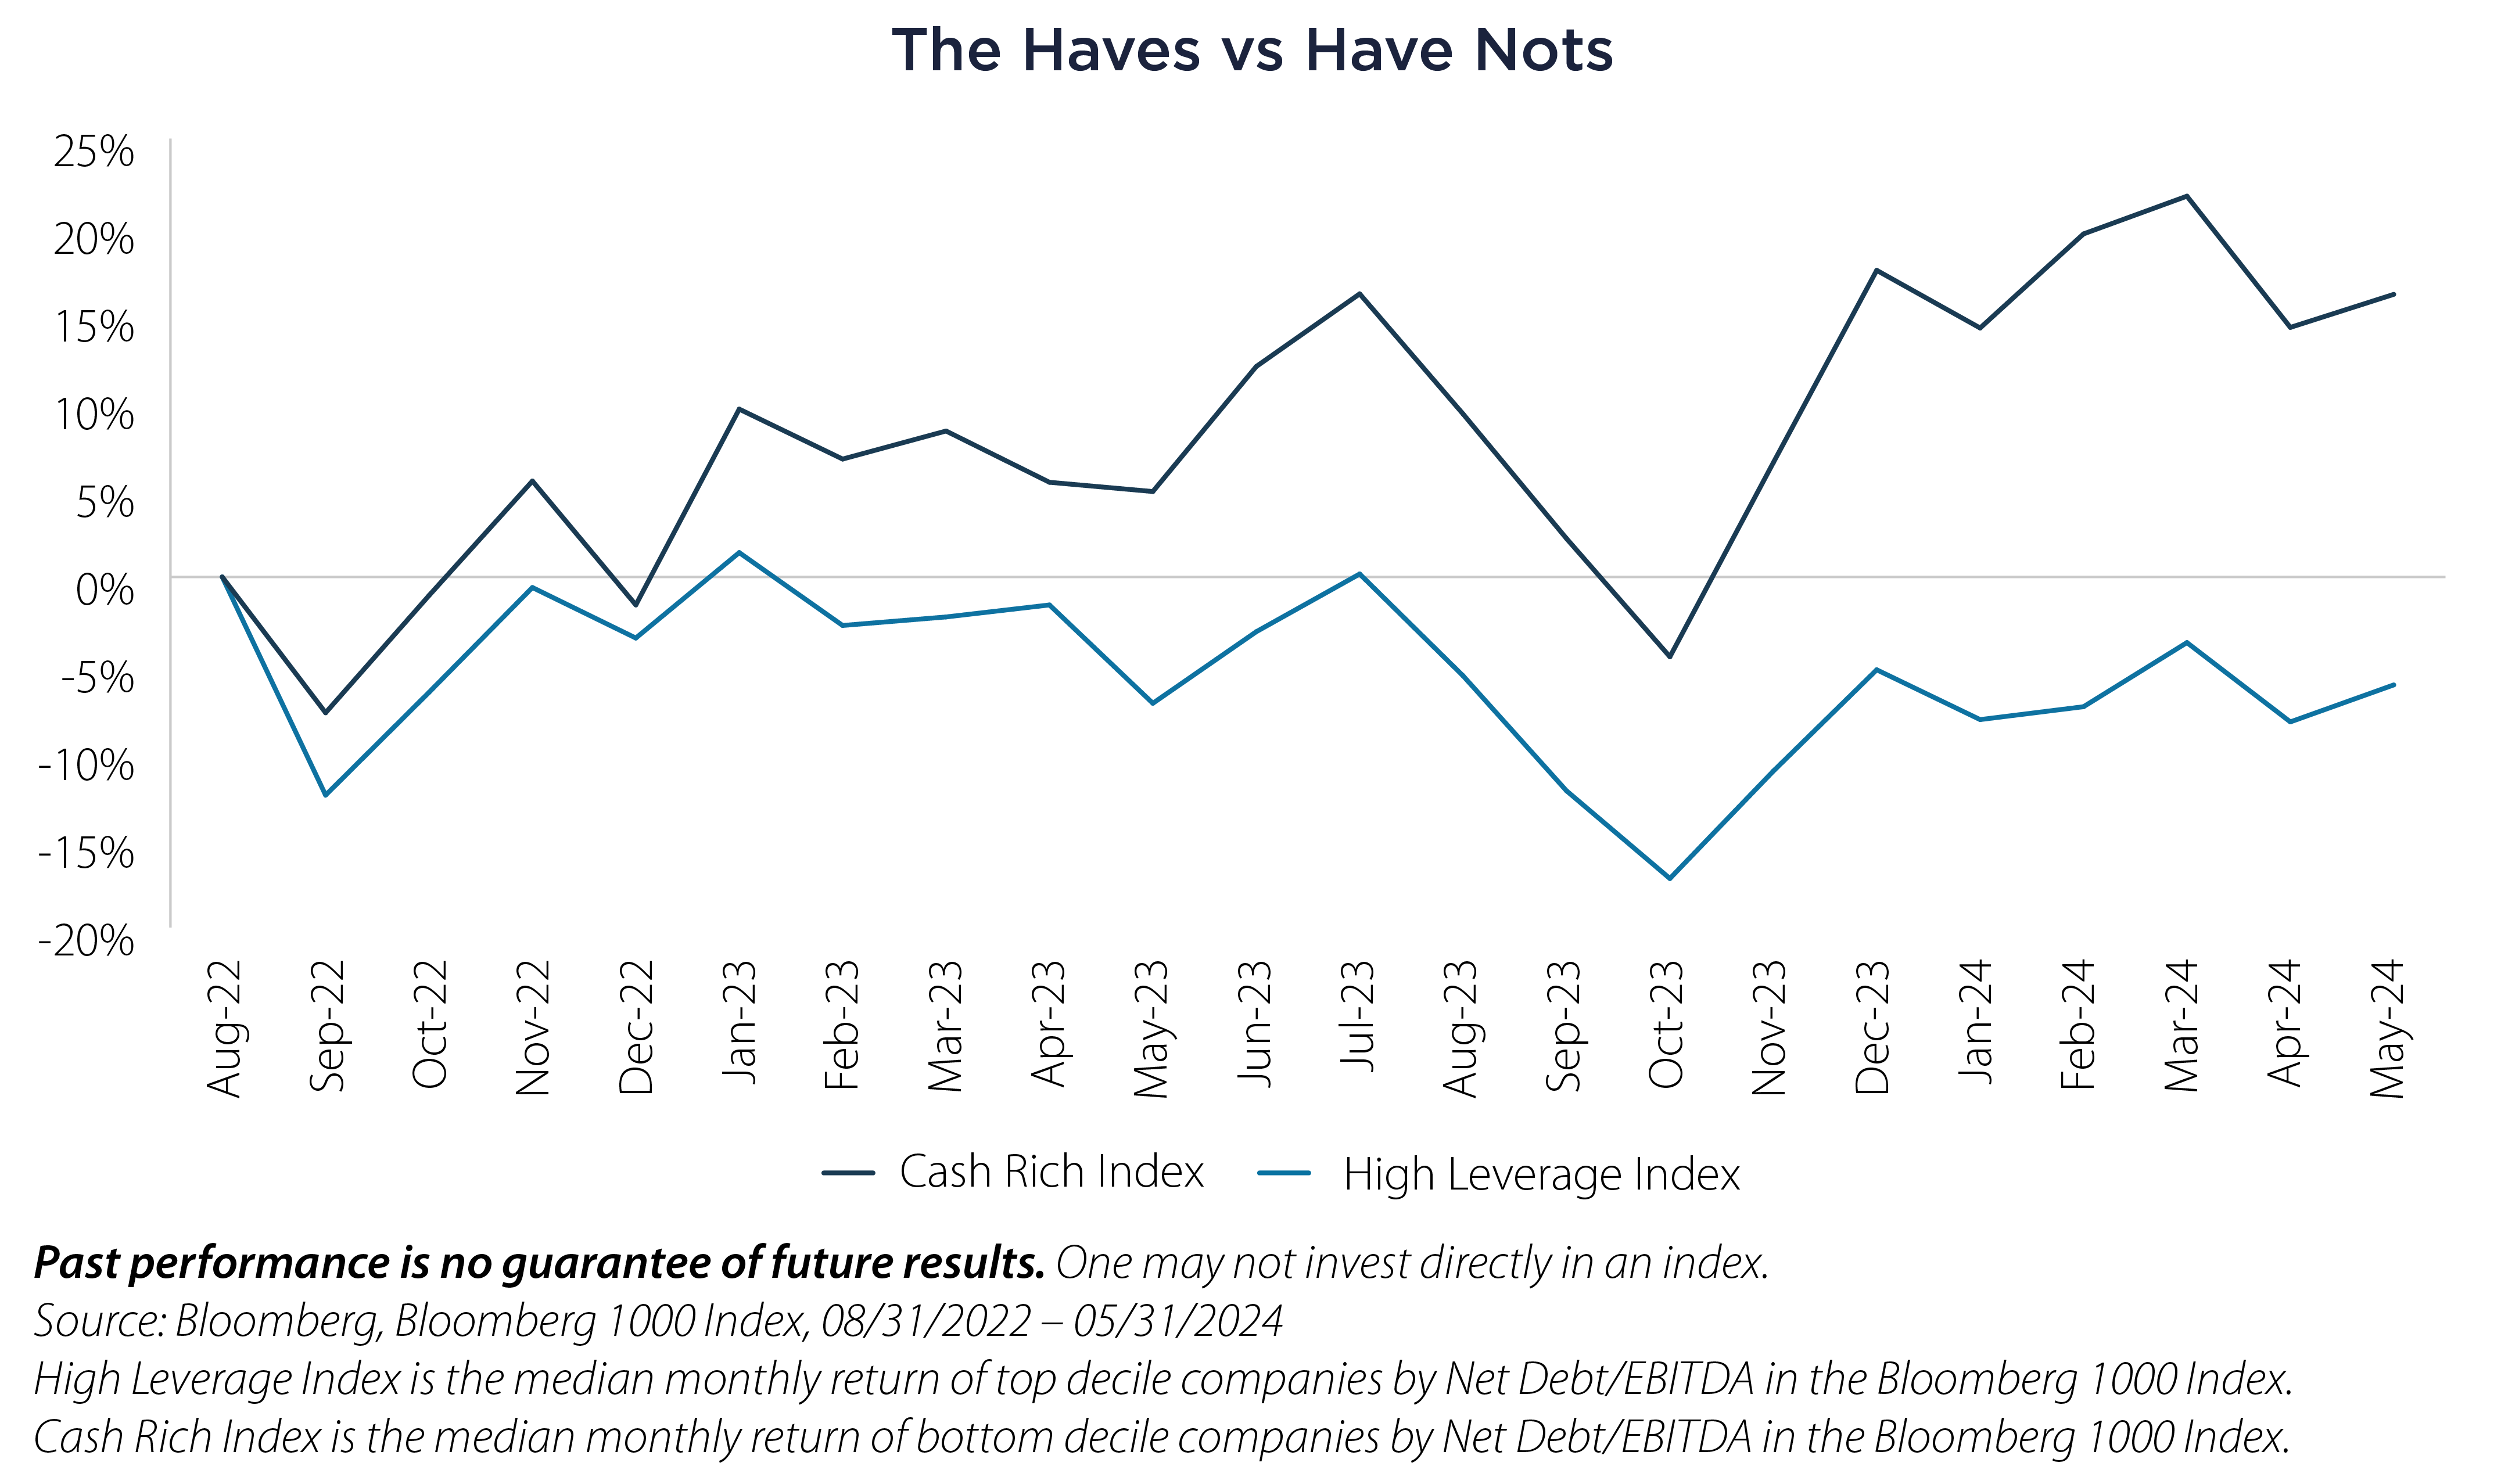
Another way to view this phenomenon is by examining the monthly median valuation of the top decile of leveraged companies since the Federal Reserve started raising interest rates at the start of 2022. As depicted below, higher real rates have penalized more indebted companies, which had previously benefitted from higher inflation and lower real rates.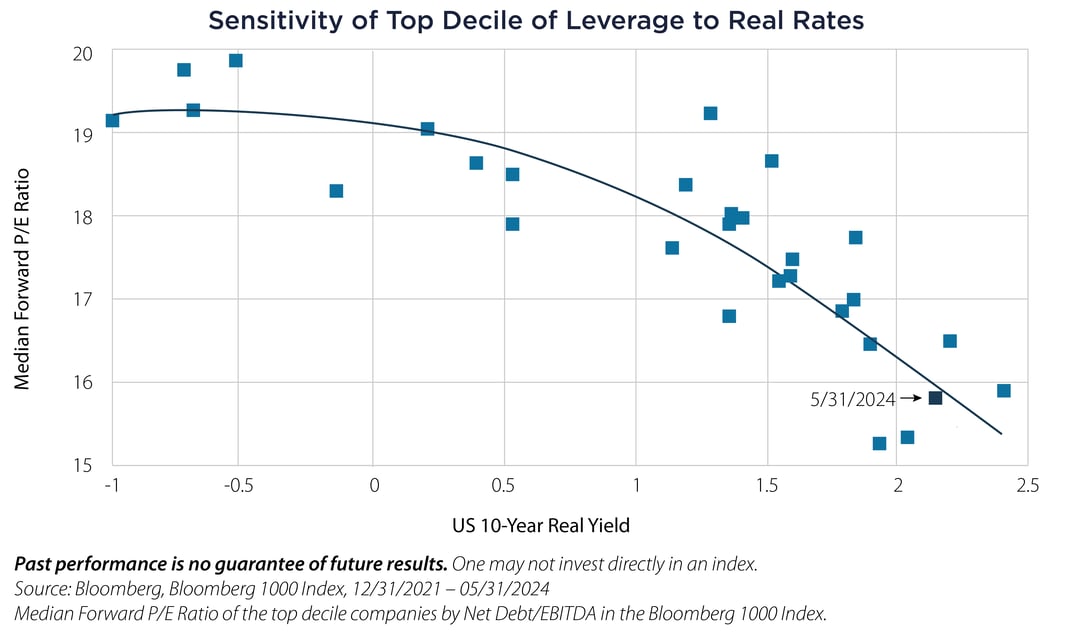
Going forward, if real yields come down, whether due to higher inflation or lower interest rates, more leveraged companies (and Small Caps by extension) could potentially benefit. Until then, we might continue witnessing the disparity between the cash-rich and the debt-burdened.
Important Disclosures & Definitions

Bloomberg 1000 Index: a float market-cap-weighted benchmark of the 1000 most highly capitalized US companies.

Forward Price/Earnings (P/E) Ratio: a stock valuation metric that compares a company’s share price to its projected future earnings.

Net Debt-to-EBITDA Ratio: a debt ratio that shows how many years it would take for a company to pay back its debt if net debt and EBITDA are held constant.

Russell 2000 Index: measures the performance of the small-cap segment of the US equity universe.

S&P 500 Index: widely regarded as the best single gauge of large-cap US equities. The index includes 500 leading companies and covers approximately 80% of available market capitalization.

Z-Score: a numerical measurement that describes a value's relationship to the mean of a group of values, measured as standard deviations from the mean. If a Z-score is 0, it indicates that the data point's score is identical to the mean score. A Z-score of 1.0 would indicate a value that is one standard deviation from the mean.

One may not invest directly in an index.

AAI000711 06/18/2025