
•    Compared to public equities, Private Equity (PE) has exhibited significant “mojo” over the past several decades, providing compelling risk-adjusted returns vs. public equity over long investment horizons.

•    However, this premium has shrunk considerably since mid-2022, which was coincident with the rapid rate increases in the US 10-year Treasury bond, a slowdown in mergers and acquisitions (M&A)/initial public offerings (IPOs) and PE exits and the rapid rise of artificial intelligence (AI)-related public equities.

•    The PE ecosystem is reliant on relatively low and stable rates, favorable company valuations, a robust M&A/IPO environment and accommodative financing. With rates stabilizing and valuations tapering, conditions may be changing to a more favorable M&A/IPO and exit environment which could further reignite and accelerate PE growth.
Although the long-term performance of PE has been strong, growth has slowed significantly over the past two years. With the end of Q2 approaching, investors are assessing portfolio performance, determining potential changes in asset allocation and planning rebalances to align with objectives and risk tolerances. Let’s look deeper to uncover critical factors and context of recent PE performance and considerations going forward.
Private-Public Premiums
The nearby chart illustrates the PE return “premium” vs public equity over the last decade, highlighting strong outperformance through 2021 with a subsequent decline in the premium through the end of 2023. During this decline, the US 10-Year yield more than doubled, from 1.52% to 3.88%, a significant impact on the cost of capital which slowed deal making and contributed to declining valuations. Add to that the historic returns of AI-related public equities over this period, and context of the decline in premium becomes a bit clearer.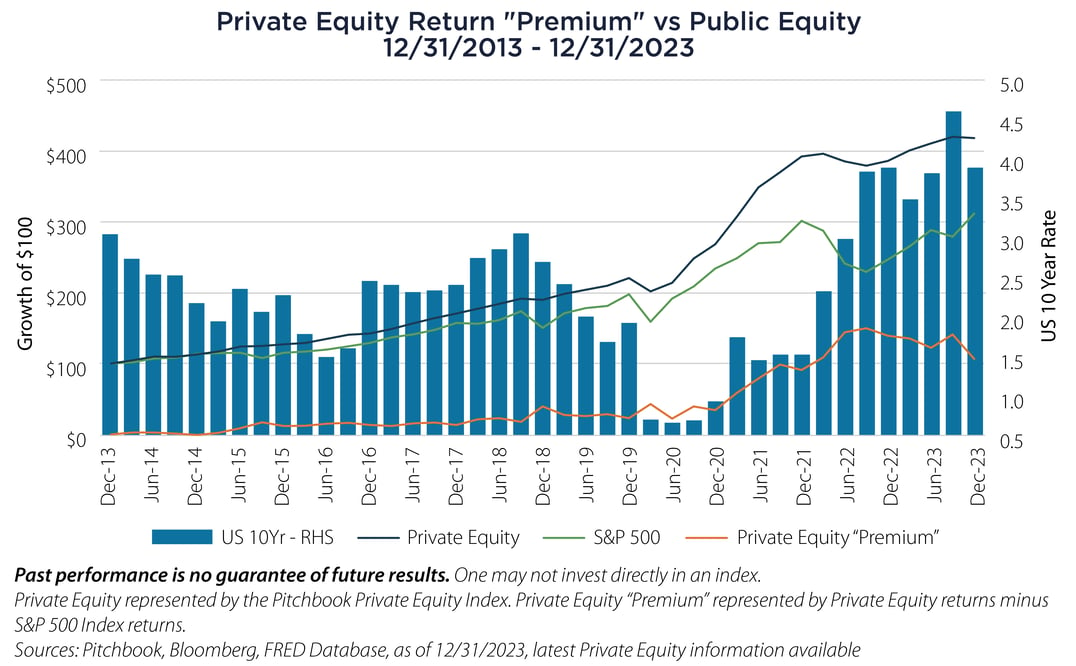
PE Exit Volume
In order to realize investment gains, PE managers must exit (or sell) a company and return capital and investment gains to investors. A decline in exit activity eventually manifests as slower growth (or even a decline) in PE returns. After peaking in 2021 at $1.1 trillion, PE exits fell dramatically, with 2023 volume at $442 billion, a decline of 59%. One emerging bright spot – annualizing 2024 YTD exits pushes 2024 estimated deal volume to $521 billion, which would be an 18% increase over 2023, indicating a potential thaw in deal activity.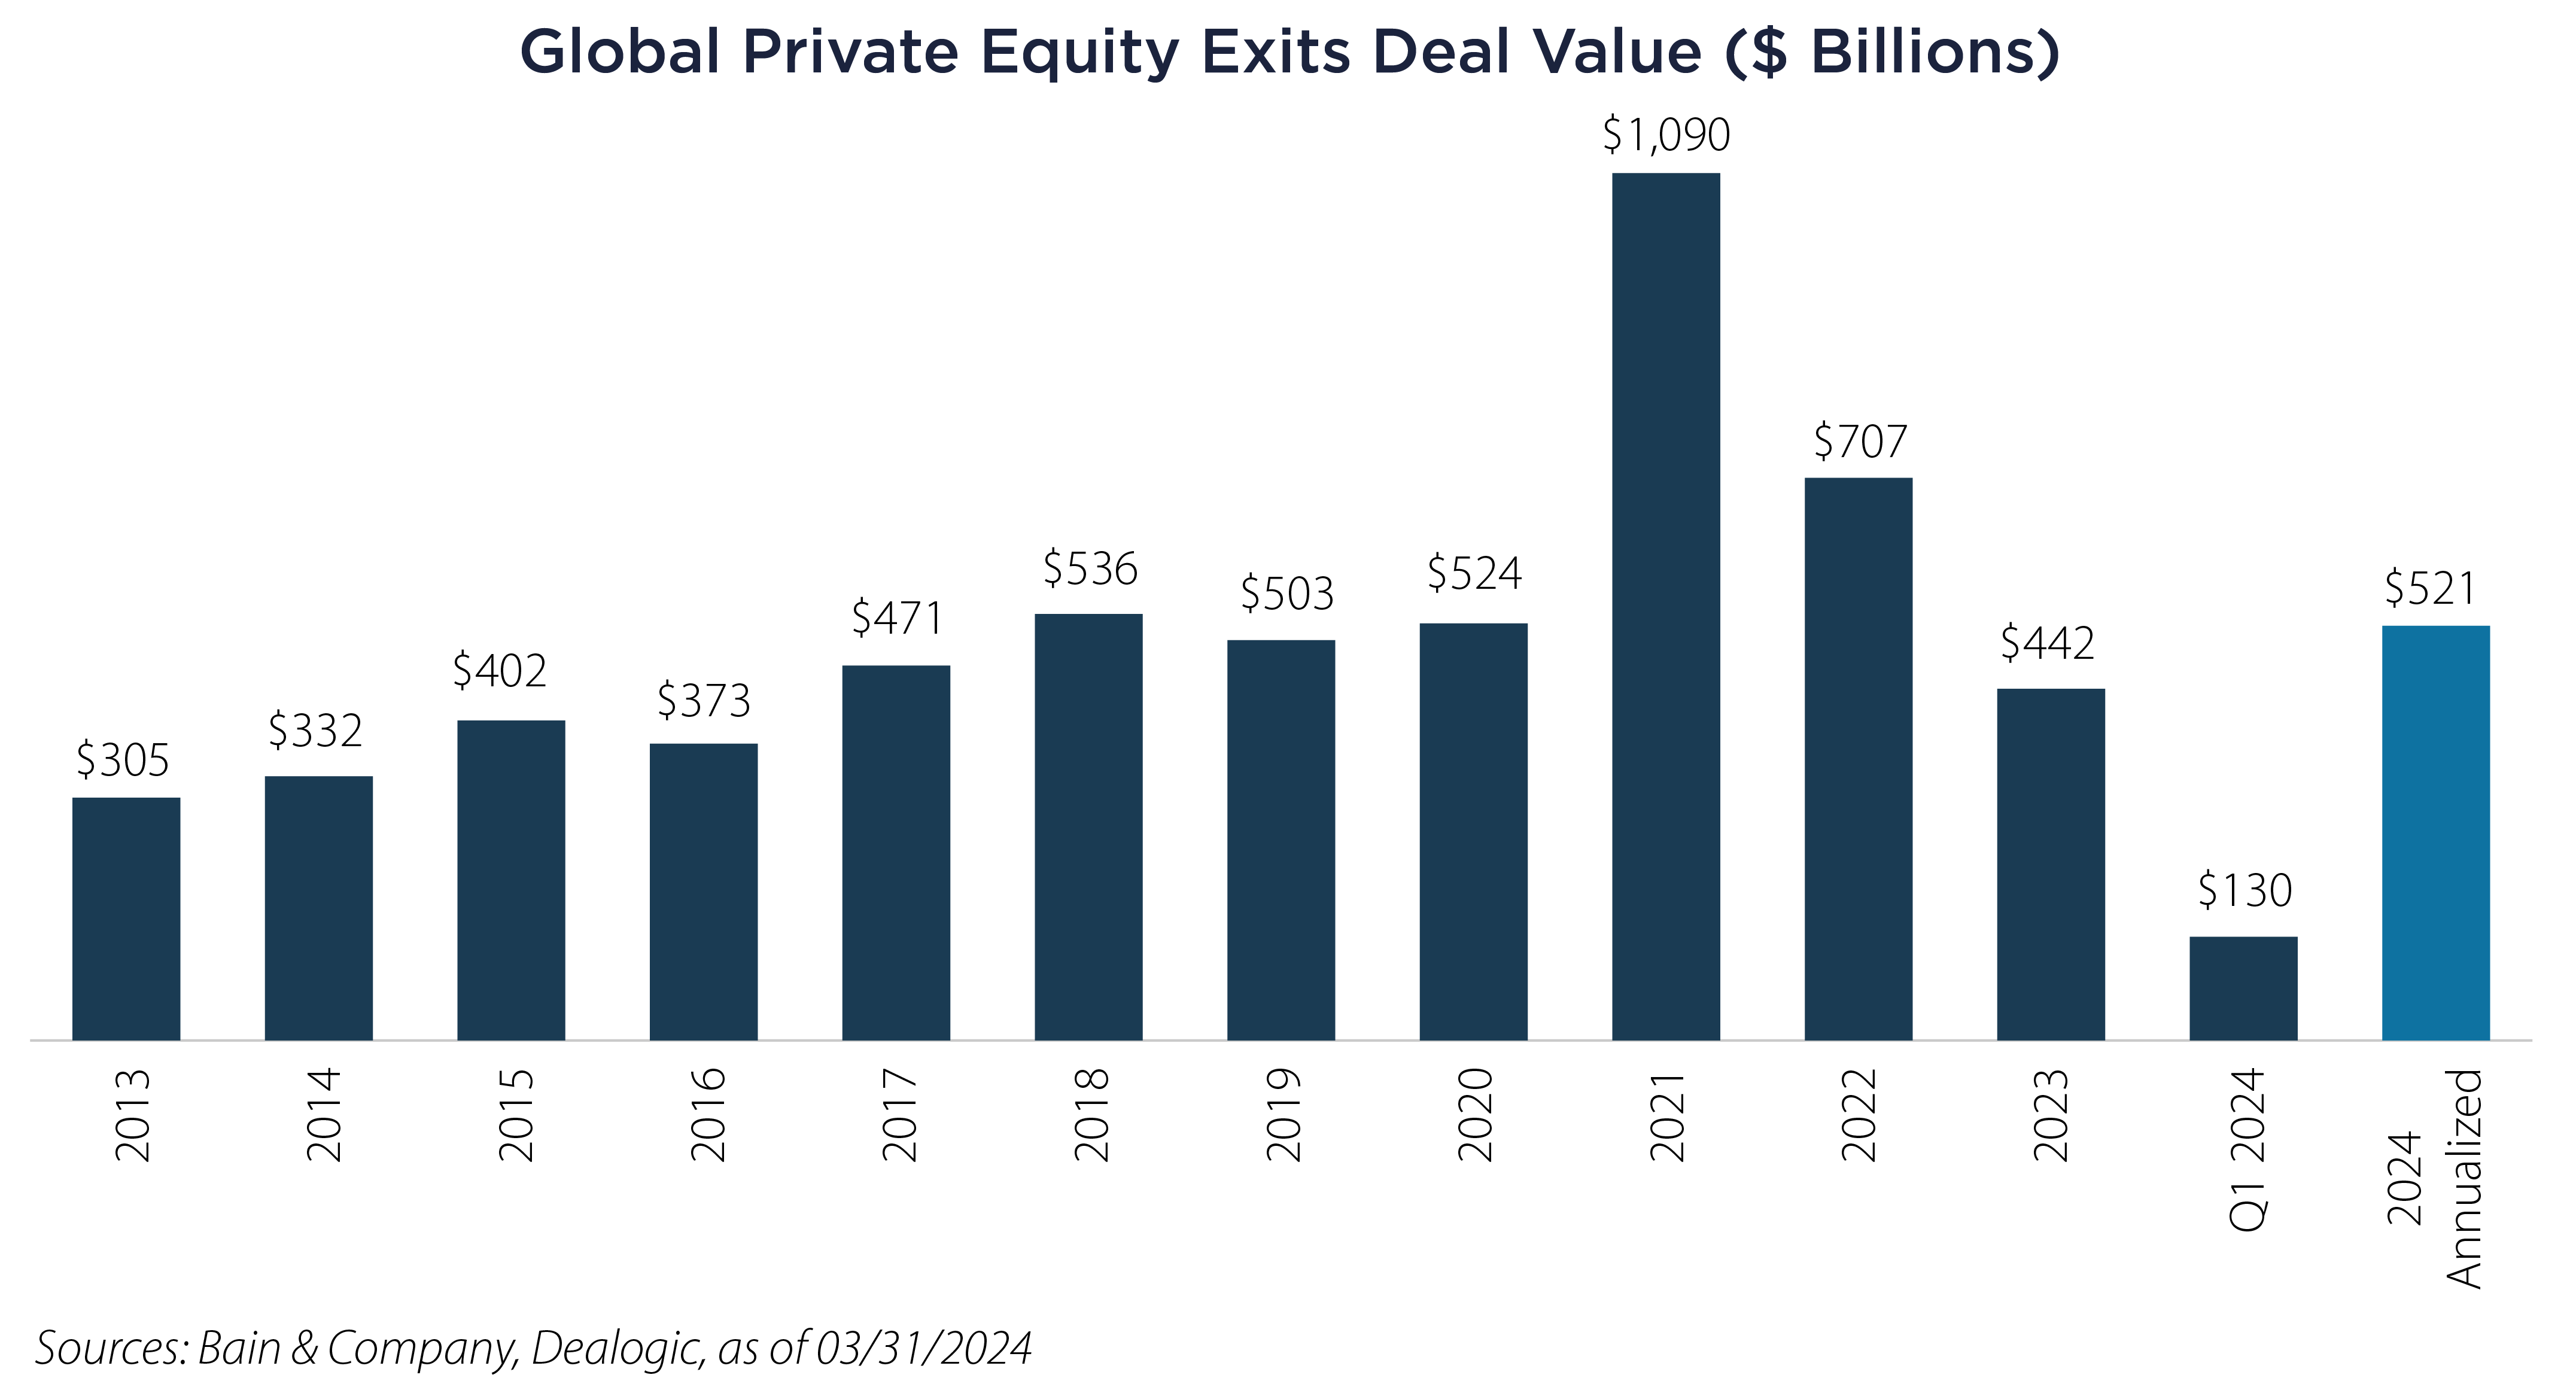
M&A/IPO Activity
The year 2021 was by far the best M&A and IPO year during the past decade as low rates and aggressive corporate growth initiatives drove activity. As highlighted by the chart nearby, deal values and volumes have slowed considerably since 2021 as the economics of increased financing costs and higher valuations were no longer penciled out for acquirers. 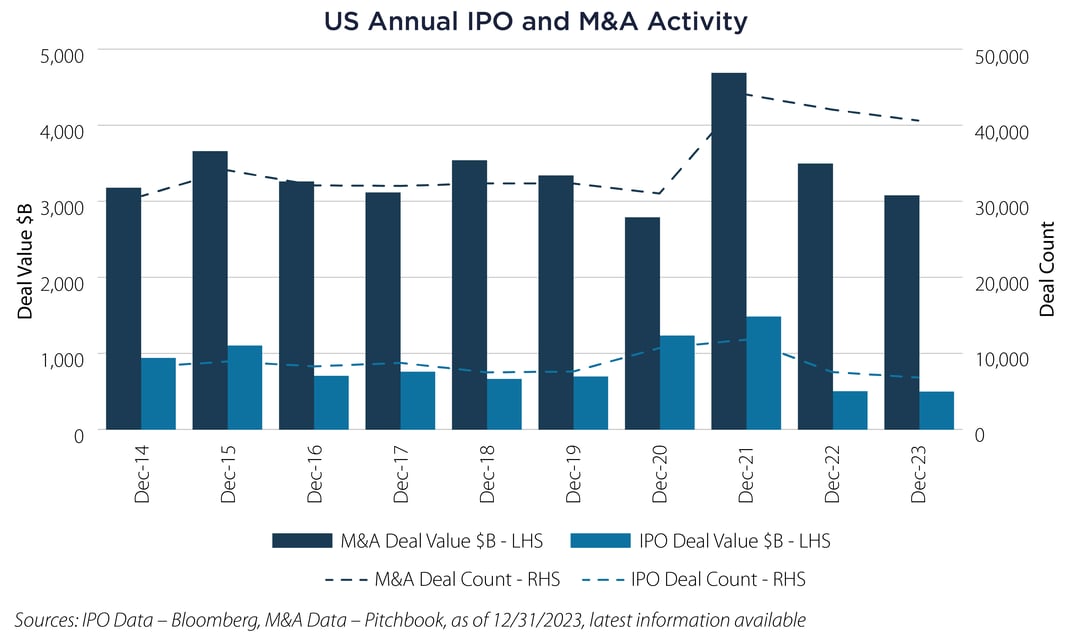
Valuations
After hitting a decade high EV/EBITDA multiple of 11.0 in 2021, private market valuations are down almost 15% through March 2024, indicating that a more favorable buying environment has emerged. As illustrated nearby, the growth of private market deal valuations has been essentially flat over that past decade while public market valuations have increased almost 30%, creating an increasingly attractive Public-Private valuation spread. A high Public-Private spread (where public is more expensive than private) can favor more M&A activity for growth vs. internal investments for acquirers.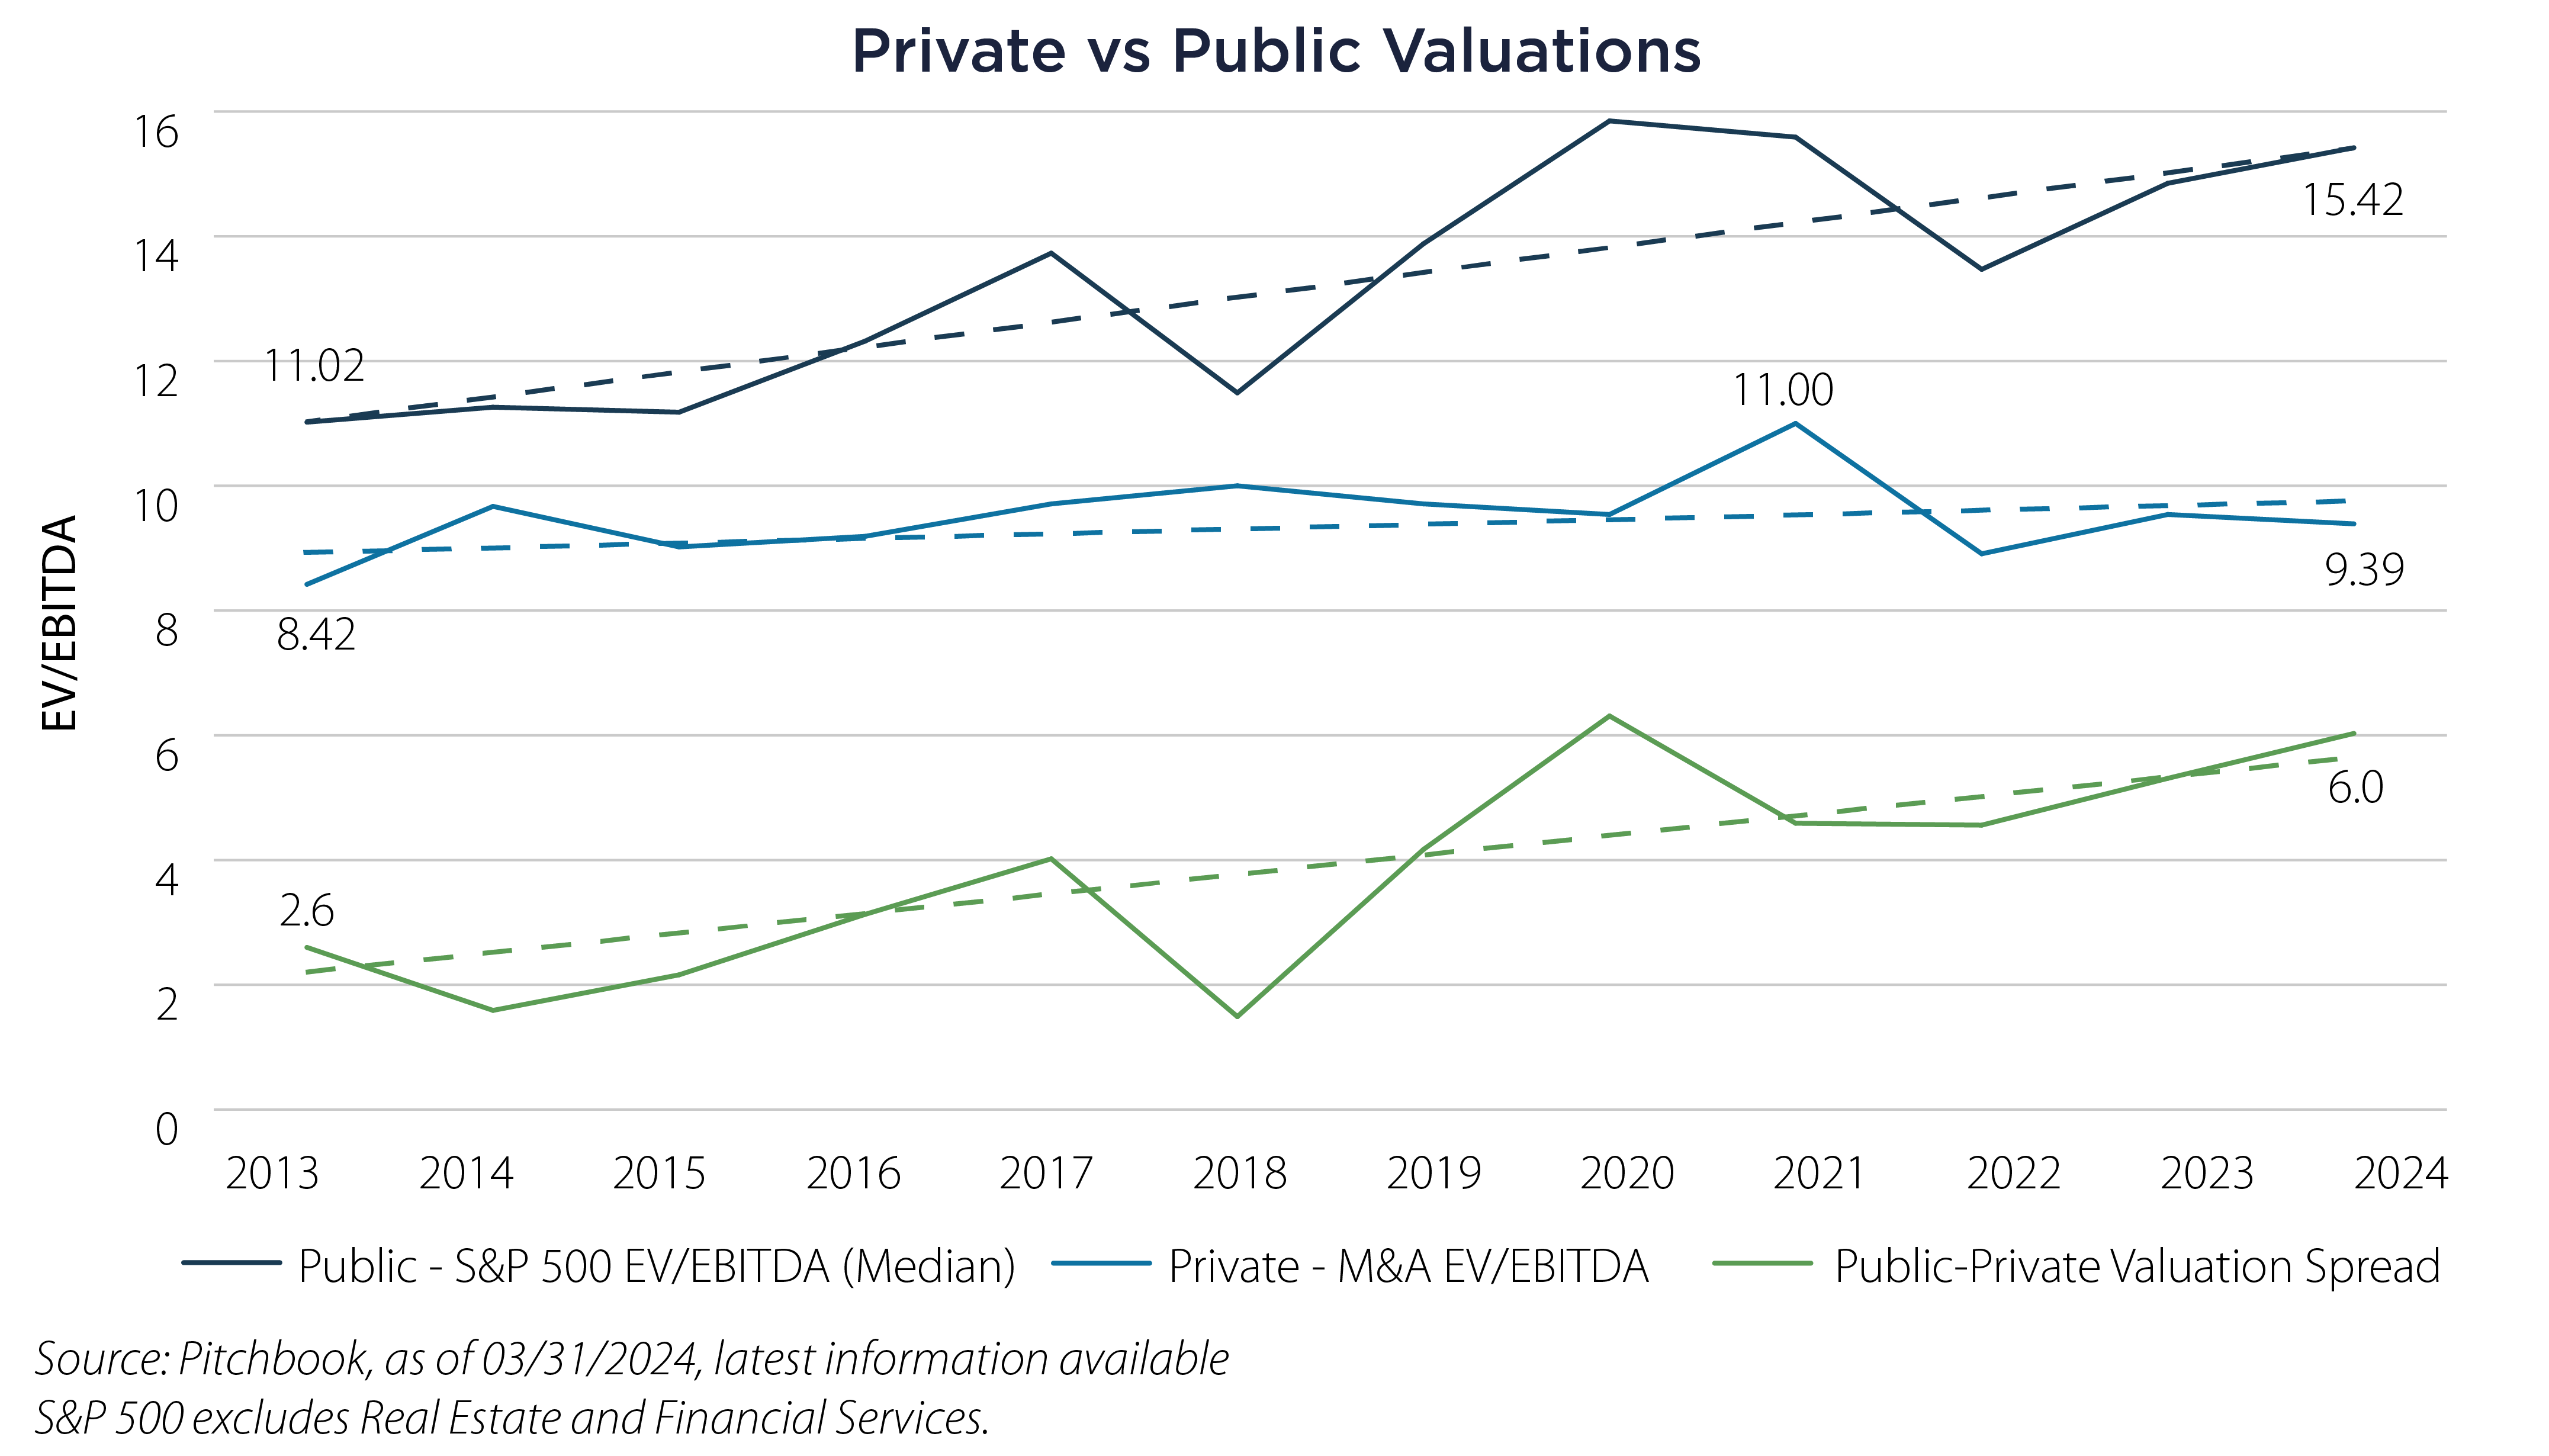
Mojo Rising
The PE ecosystem is reliant on relatively low and stable rates, favorable company valuations, a robust M&A/IPO/exit environment and accommodative financing. For the past two years, these conditions have been sub-optimal, with PE growth slowing vs. historic averages.
Although we are highlighting early signals, much of the data indicates that more favorable conditions for PE appear to be returning with improvements in deal volume/value, valuations and more accommodative financing.
In addition, studies from consulting firms and investment banks1,2,3,4 indicate strong corporate balance sheets, improving financing conditions and rising CEO confidence, all of which are constructive for an increase in M&A activity, which will likely be favorable to the PE ecosystem.
We doubt that PE has lost its mojo. Rather, after a relatively short lull, it appears to be rising.
Important Disclosures & Definitions

1 EY Parthenon, M&A Outlook Signals Rebounding US Deal Market Activity in 2024, May 10, 2024.

2 PWC, 2024 Outlook: Global M&A Industry Trends, January 23, 2024.

3 Goldman Sachs, 2024 M&A Outlook: From Stability to Strength, January 2024.

4 Morgan Stanley, 2024 M&A Outlook: Ready for Rebound, January 22, 2024.

EV/EBITDA (Enterprise Value/Earnings before Interest, Taxes, Amortization, and Depreciation): a valuation which measures the multiple of company value over a proxy for cash earnings.

Mergers and Acquisitions (M&A): the area of corporate finances, management and strategy dealing with purchasing and/or joining with other companies.

Pitchbook Private Equity Index: compiled from private equity investors and limited partners, measures the quarterly net asset value change of the private equity funds in the Pitchbook universe, considering both contributions and distributions during the period.

S&P 500 Index: widely regarded as the best single gauge of large-cap US equities. The index includes 500 leading companies and covers approximately 80% of available market capitalization.

One may not invest directly in an index.

AAI000714 06/25/2025