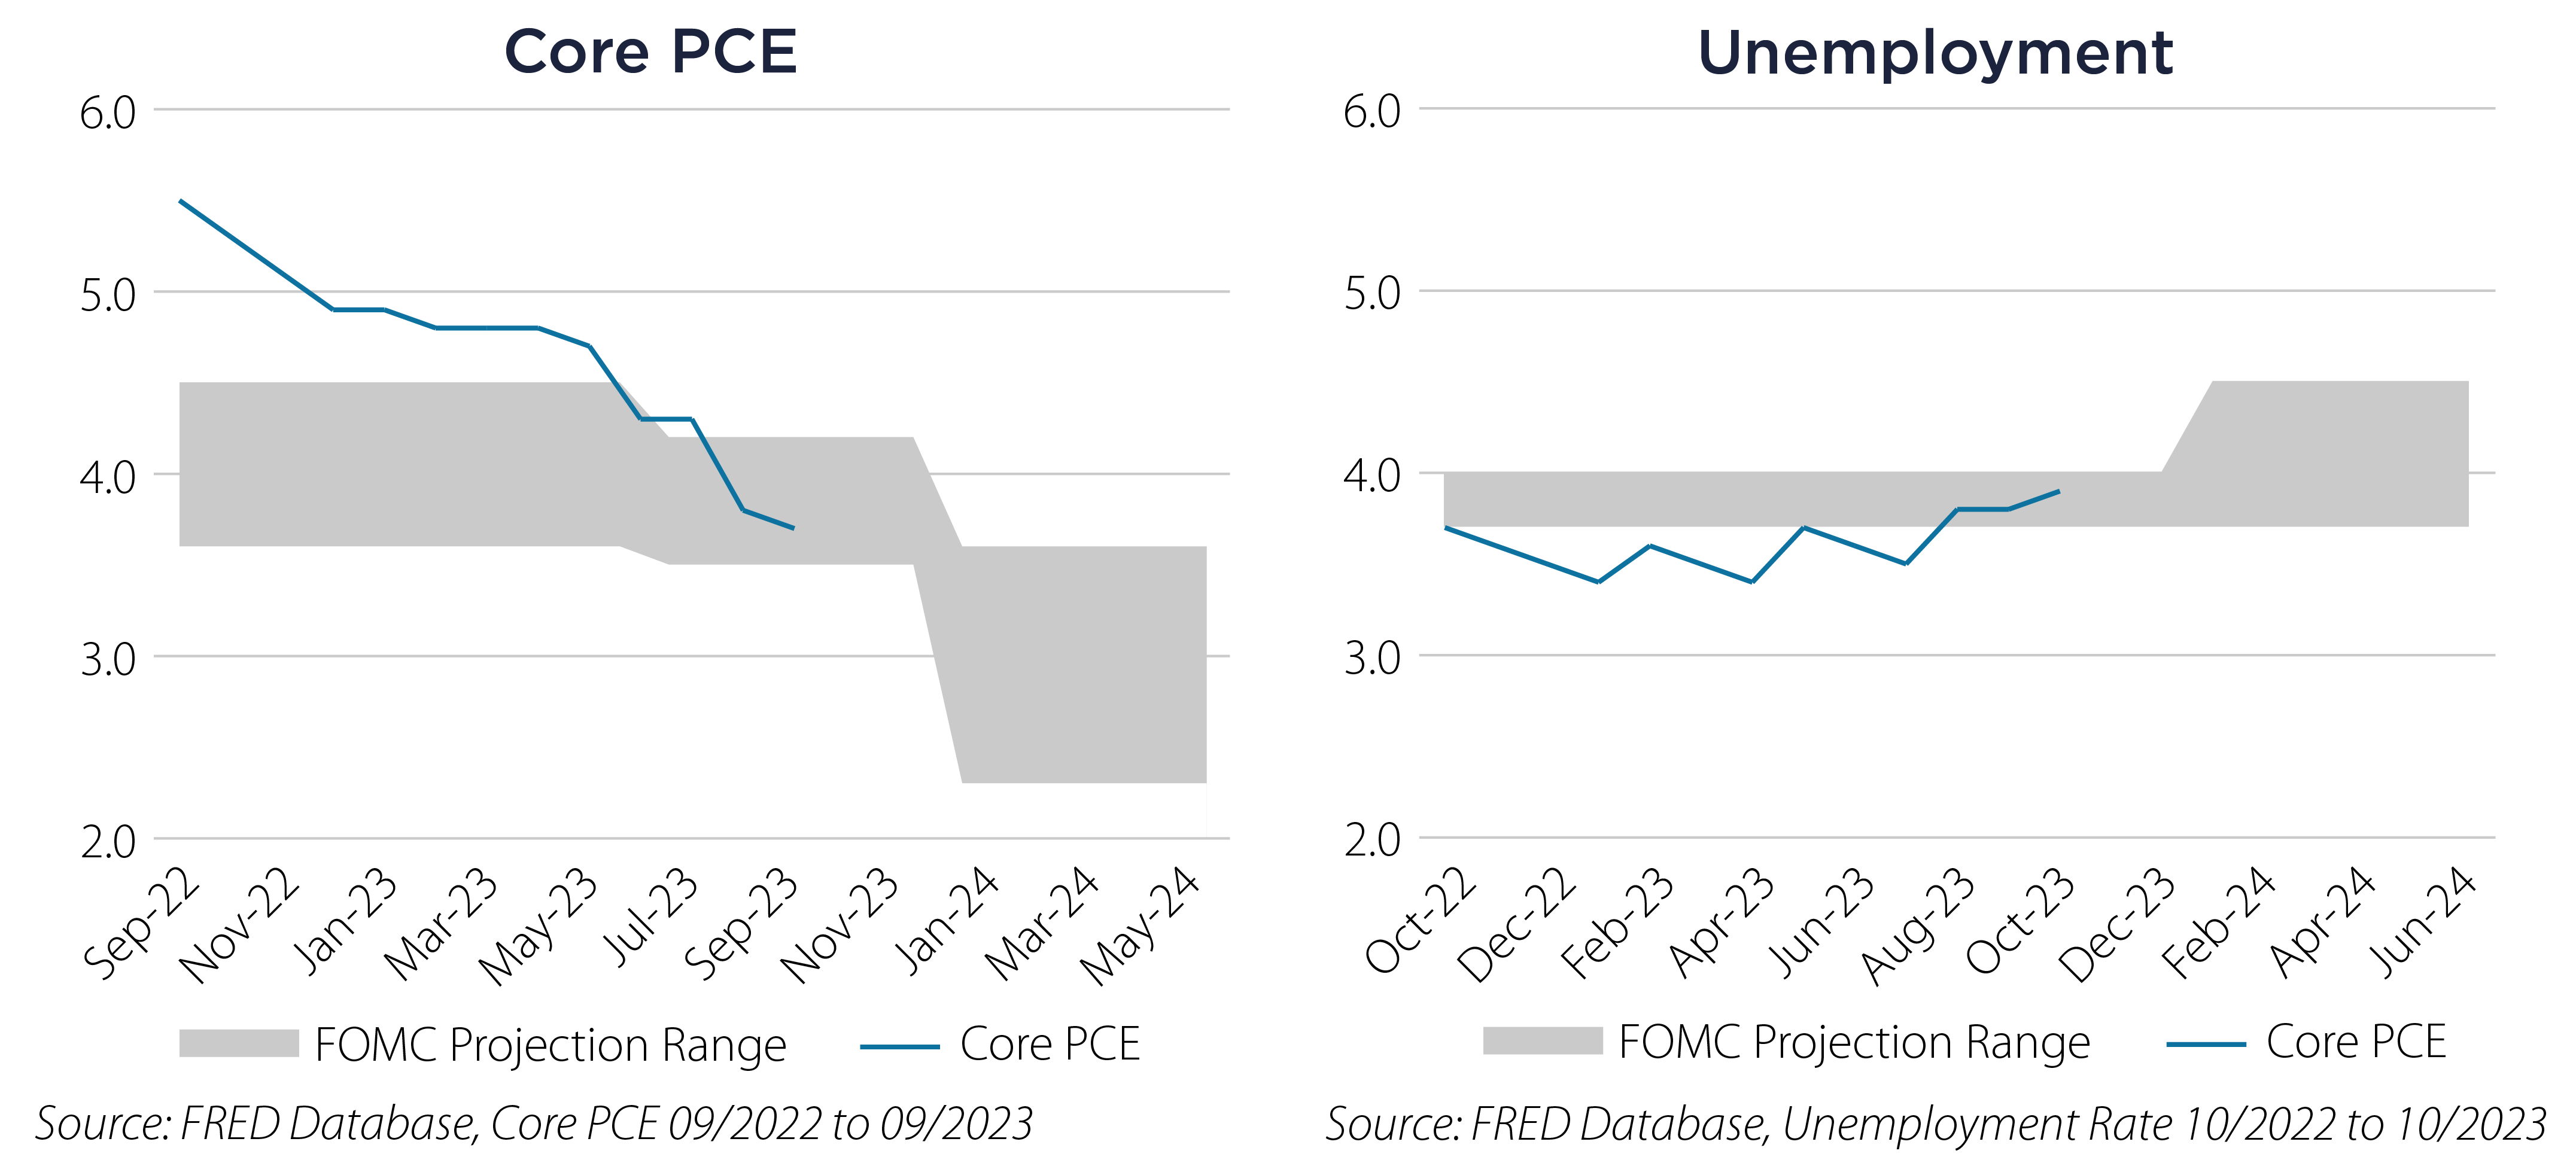
Last summer we noted that hotter-than-expected economic data was pouring in. The 10-year Treasury reacted by selling off to 5% and the S&P 500 sold off 10.2%.1 But most recently as the calendar turned to autumn, we have witnessed moderating data versus expectations for the two key headline inflation and unemployment metrics. As a result, the 10-year Treasury yield has moved down about 50 basis points (bps) and stocks have nearly fully recovered that loss.2
Ignoring the market’s volatile reactions to these key policy variables, the bigger picture view suggests that rate hikes are finally beginning to impact the economy as intended. The market is now more convinced the Federal Reserve (Fed) is on hold, with both data series moving towards the Fed’s own forward-looking estimates.
The market (and the Fed) are currently projecting a reduction in short term rates to occur sometime in the summer of 2024 if these trends continue.
Key Policy Variables over the past Year versus FOMC Projections:

Fool me once, shame on you. Fool me twice, shame on me. Fool me three times, shame on us both.
Both the market and the Fed have been fooled in this post-COVID-19 pandemic cycle and re-adjusted their outlook multiple times, which shows the pitfalls of relying on lagged inflation and unemployment data to project into the future.
However, the implication for the Fixed Income markets is clear if these trends hold and the data moves into the Fed’s projection cone in 2024. The current Federal Funds rate of 5.25-5.5% would be admittedly too restrictive. In this case it would make sense to move some exposure from the short end into higher quality parts of the core bond market where higher yields exist today. Intermediate investment grade and municipal bonds are currently available at higher yields than are available in money markets. We prefer active managers that have the ability to avoid index weightings and pick bonds that offer value along the curve.
Nobody really knows where the data is headed longer term, but the trend towards cooler data could justify a softish landing in 2024 with the Fed’s help.
Important Disclosures & Definitions

1 Source: Bloomberg. The S&P 500 fell 10.2% from 07/31/2023 to 10/27/2023 and the 10-year CMT Treasury peaked at 4.98% on 10/19/2023.

2 Source: Bloomberg. The S&P 500 rose 9.5% from 10/27/2023 to 11/16/2023 and the 10-year CMT Treasury stood at 4.53% on 11/15/2023.

Basis Point (bps): a unit that is equal to 1/100th of 1% and is used to denote the change in a financial instrument.

Investment Grade (IG): a rating that signifies that a municipal or corporate bond presents a relatively low risk of default. To be considered an investment grade issue, the company must be rated at 'BBB' or higher by Standard and Poor's or Moody's. Anything below this 'BBB' rating is considered non-investment grade.

Municipal Bond: a debt security issued by a state, municipality, or county to finance its capital expenditures, including the construction of highways, bridges, or schools. They can be thought of as loans that investors make to local governments. Municipal bonds are often exempt from federal taxes and most state and local taxes (for residents), making them especially attractive to people in higher income tax brackets.

One-Year Constant Maturity Treasury (CMT): represents the one-year yield of the most recently auctioned Treasury securities.

Personal Consumption Expenditures Price Index (PCE): a measure of the prices that people living in the United States, or those buying on their behalf, pay for goods and services. The PCE is known for capturing inflation (or deflation) across a wide range of consumer expenses and reflecting changes in consumer behavior.

S&P 500 Index: widely regarded as the best single gauge of large-cap US equities. The index includes 500 leading companies and covers approximately 80% of available market capitalization.

One may not invest directly in an index.

AAI000587  11/28/2024


