
•    Over the past ten years, Developed European equities have underperformed the United States by over 700 basis points (bps) per year.

•    Over that period, earnings multiples have decreased in Europe while increasing in the US.

•    The spread in earnings multiples is now over 7.5X.
Over the past ten years, it has worked in investors’ favor to be overweight US Equities and underweight Developed Europe. The chart below shows the total returns of the S&P 500 Index vs. the MSCI Europe Index:
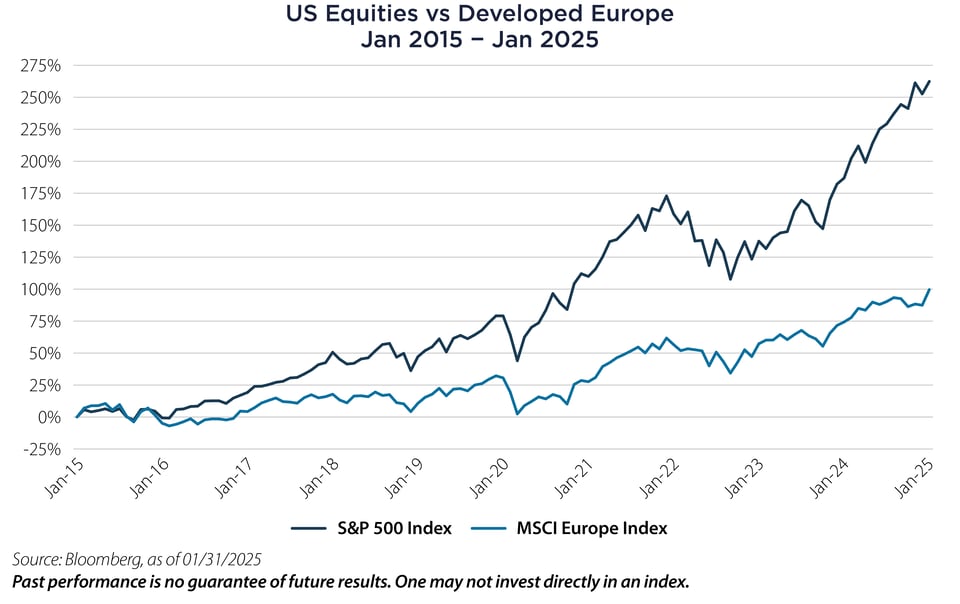
The fundamentals in the US have warranted this outperformance, as companies in the S&P 500 have, on average, had faster sales and earnings growth over this period. The makeup of the indexes is also very different, with US companies having greater exposure to growth-oriented parts of the market like Technology, Consumer Discretionary and Communication Services. Europe tends to be more heavily tilted towards cyclical value sectors such as Financials and Industrials.
That said, the current valuation differential between the two regions is approaching ten-year highs. The chart below tracks the difference between the Price/Earnings ratio for the US vs. that of Europe.
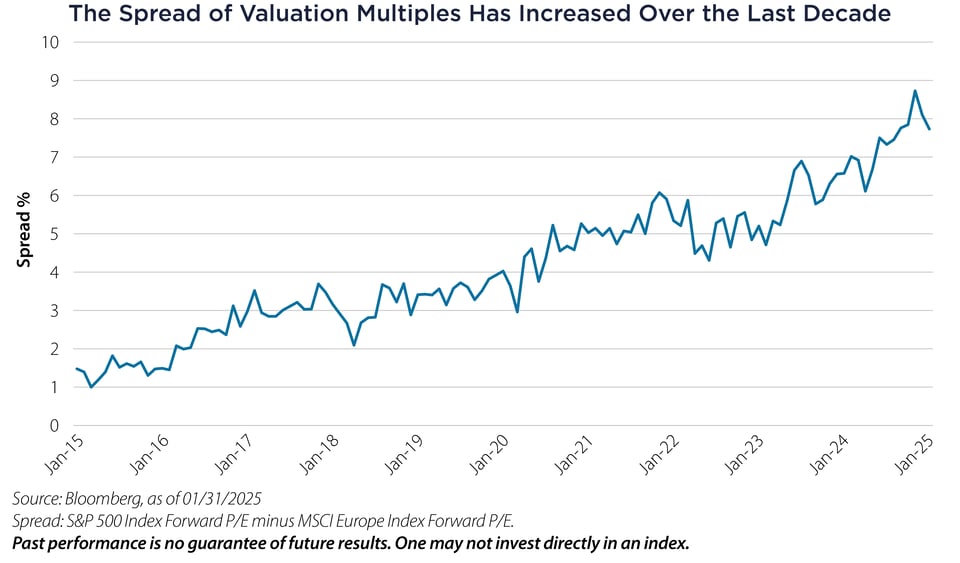
As the chart shows, back in 2015 the US enjoyed about a one-point multiple advantage to Europe, which over the past ten years has increased to over seven and a half points. This has happened primarily from multiple expansion in the US. In addition, dividend yields in the MSCI Europe Index are currently over 3% vs. just over 1% in the S&P 500 Index.
Europe certainly faces some unique headwinds, including global geopolitics, the war in Ukraine and generally slower economic growth. However, current valuations relative to the US may discount some of the potential bad news. Combine that with the relatively attractive dividend yields Europe enjoys, and value investors may want to dust off Developed Europe as part of a well-diversified portfolio allocation.
Important Disclosures & Definitions

Basis Point (bps): a unit that is equal to 1/100th of 1% and is used to denote the change in a financial instrument.

Forward Price/Earnings (P/E) Ratio: a valuation metric that compares share price to projected future earnings.

MSCI Europe Index: captures large- and mid-cap representation across 15 Developed Markets (DM) countries in Europe. With 414 constituents, the index covers approximately 85% of the free float-adjusted market capitalization across the European Developed Markets equity universe. One may not invest directly in an index.

Price/Earnings (P/E) Ratio: a valuation ratio of current share price compared to per-share earnings.

AAI000889 02/18/2026