
"This is a golden moment for private credit.”

- Jonathan Gray, President and Chief Operating Officer, Blackstone, Blackstone Earnings Call, April 2023
In our ongoing discussions with our advisor clients, we are finding significant interest in private credit, but gaps exist in understanding the different strategies, structures and potential risks and rewards. Private credit involves making direct loans to privately owned companies from non-bank sources. It is a large $1.7 trillion market,1 which is already roughly the size of the public High Yield US debt market.
We will focus on direct lending as it is the largest component of private credit, although there are other forms of lending including opportunistic, cash flow-based and distressed financing. What follows is a brief explanation on the growth and popularity of private lending vehicles, an overview of some of the structures and strategies and a basic framework for risk management.
Private Lending’s Rapid Growth
The Direct Lending sub-sector makes loans to small- to mid-sized private companies (those with revenues between $10 million and $1 billion). The nearby chart shows its rapid growth, which began due to structural changes in the banking system since the Great Financial Crisis in 2008.
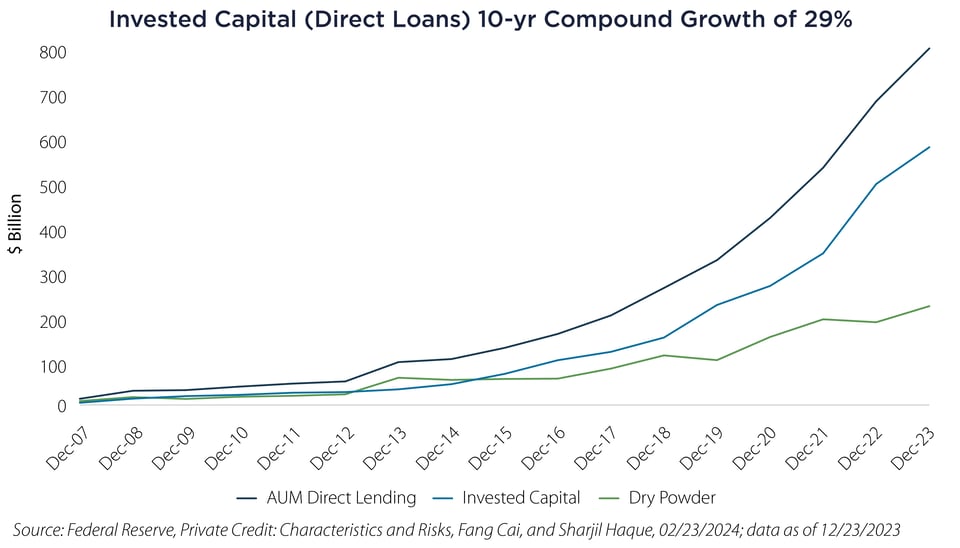
Regional banks, which once dominated loans to middle-market private companies, have significantly reduced their exposure and tightened lending standards due to regulatory, liquidity and capital issues. In response, investors and specialized finance companies have stepped in to fill the loan supply gap. In fact, as of 2022 it is estimated that Private Credit now finances 75% of all leveraged loan transactions.2 These loans play a crucial role in the economy—as middle market companies may employ up to one-third of the US workforce.3
Private credit offers customized, quick and easy access to different types of funding that these companies may otherwise not have. The demand side from investors has also increased as the typical loan may currently offer yields of +500 to +800 basis points (bps) over short term floating rate benchmarks, which are currently in the range of 10% to 13%. It is not surprising then that another growth driver is the current interest rate environment, as short benchmark rates are the highest along the yield curve. All of these factors combined are positive at the moment and are expected to continue, leading some to suggest this is the “Golden Age of Private Credit.” At the same time others would suggest it has the potential to be the epicenter of the next financial crisis.
Common Private Lending Structures
The most common investment options for direct lending are private direct lending funds and Public/Private Business Development Companies. They can have similar lending mandates, but there are important differences between them. The most important differences relate to liquidity, volatility (valuation methodology/frequency) and leverage and management/performance fees. The charts nearby summarize the various characteristics and differences in the vehicles.
Liquidity/Volatility
| Lending Vehicle | Public/Private | Liquidity | Historical Volatility | Investor | Strategy(ies) |
| Private Direct Lending Funds (LPs) | Private | LOW. Lock-up but with some options for limited liquidity (i.e. evergreen, periodic tenders) | Low | Primarily institutional/accredited | Most often the purest play for Direct Lending; Senior Secured Floating Rate 5-year loans |
| Business Development Companies (BDCs) | Private | Medium | Accredited investors (minimums vary) | Direct Lending as above but up to 30% can be invested in other assets, including subordinated debt and equity | |
| Business Development Companies (BDCs) | Public | HIGH. Daily liquidity via market exchange | High | Primarily Retail |
Leverage/Fees*
| Lending Vehicle | Typical Leverage | Target Yields (IRRs) | Typical Management Fee | Typical Incentive Fee/Hurdle | Exit Time Horizon |
| Private Direct Lending Funds (LPs) | 1:1 Debt/Equity | Highest | 0.5-1% | 10%/over 8% | 5 years |
| Business Development Companies (BDCs) | Up to 2:1 Debt/Equity Public |
Highest | 1-1.5% | 20%/over 8.25% | Varies but typically significant redemption fees |
| Business Development Companies (BDCs) | High | Daily |
Source: Cambridge Associates, as of July 2023
* Note: Excludes underlying fund expenses which can be significant for Business Development Companies (BDCs).
Due Diligence Considerations
Given the unique nature of these strategies, we believe it is paramount for investors to understand the philosophy and approach of the investment team, especially if capital is locked up for an extended period of time.
- Experience/Team – Tenure and experience of investment team and length of time managing the strategy(ies).
- Deal Flow – Loan origination and structure, i.e., club deals.
- Types of Lending/Strategy – Types of loans being underwritten, i.e., direct, opportunistic, cash flow or distressed.
- Valuation Methods – Insights and clarity on portfolio valuation methodology and frequency.
- Credit Risk – Details on underwriting policy, including thresholds that are not to be exceeded, cyclicality and deal examples.
- Covenants/Loan Structure – Measures and policies in place to mitigate loan distress and/or defaults.
- Leverage – Details and policies on the use of structural leverage, along with understanding of cost of capital and maturities.
Final Thoughts
When we hear the words “golden age” regarding any investment, we immediately turn on our warning indicators, especially for fixed income and loan investments. Where did we last hear about an infallible sector in the lending market that used a popular effectively leveraged structure? Oh yeah, it was the “Golden Age of Mortgages” back in 2007.
The key point is that, for any allocation to credit, regardless of structure, there is an asymmetric risk/reward profile. The prevailing equity-like returns and low default rates are unlikely to persist as:
- rates are unlikely to remain at today’s levels;
- higher rates could lead to higher defaults for this credit cohort regardless of how well underwritten and;
- longer term default rates are typically double current rates.
Careful due diligence and positioning are manifest as there may be emerging opportunities as the credit cycle matures. Time will tell if this truly is the “Golden Age” of private credit.
Important Disclosures & Definitions

1 Source: Federal Reserve, Private Credit: Characteristics and Risks, as of 02/23/2024

2 Source: S&P, LCD, as of 12/31/2022

3 Source: National Center for the Middle Market, Year-End 2023 Market Indicator Report

Basis Point (bps): a unit that is equal to 1/100th of 1% and is used to denote the change in a financial instrument.

AAI000707  06/11/2024